
Institutional Research
About Us
The Office of Institutional Research supports the University's planning and decision making processes by collecting, analyzing and interpreting institutional data. Explore the data visualizations and reports linked below to learn more about our community and rigorous academic standards.

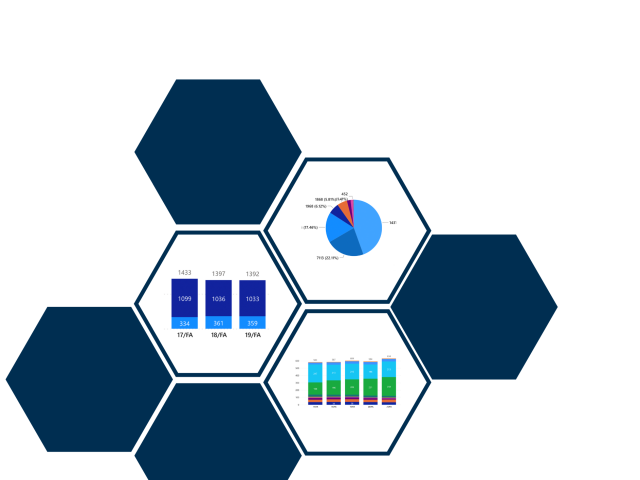
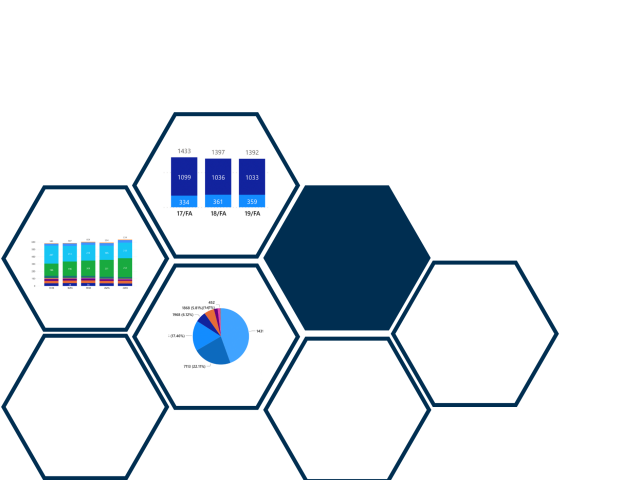
Student Enrollment
Five-Year Fall Enrollment Trend
Access aggregate enrollment data from the last five years for all academic levels.
Explore enrollment data for all students for the current term including attendance type, by college, demographic data and enrollment counts.
Engage with data regarding first-time in college student and new transfer populations.
Employee Data
Current Fall Instructional Staff Statistics and Instructional Activities
Includes an overview of instructor data including headcount by instructor type and teaching statistics.
Five-Year Fall Instructional Staff Statistics
Highlights demographic data for instructional staff for the last five years.

Five Year Fall Non-Instructional Staff Statistics
Provides data and insights pertaining to University staff. Identifies trends over time.

Degrees Awarded
Use the Ten Fiscal Year Trend dashboard to identify patterns related to degree awarded for the last 10 years. Engage with the Second Major Award dashboard to review the relationships between student first and second majors between 2012 and 2021. Explore the Awards in STEM dashboard to access bachelor and master level degrees awarded in STEM since 2012.

Graduation and Retention Trends
In alignment with Goal 6 of the Strategic Plan, our goal through these dashboards is to provide the Kean community with access that promotes effective communication and collaboration. All members of the university community should actively support recruitment, retention and graduation focused initiatives. Use the Retention Rate Trends dashboard to understand retention patterns over time and the Graduation Rate Trends dashboard for first-time in college freshmen and the Outcome dashboard for transferred students to better understand the path to matriculation and how we can better support our students in reaching that milestone.